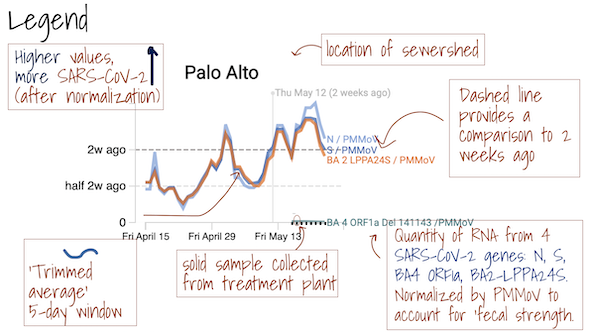
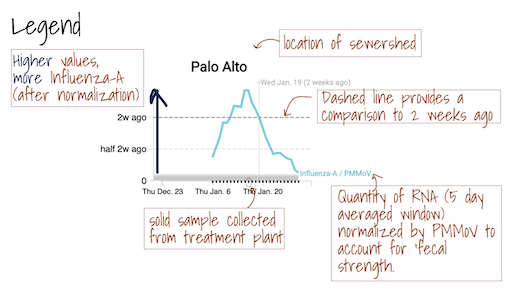
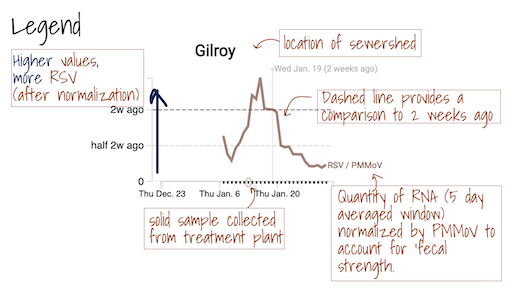
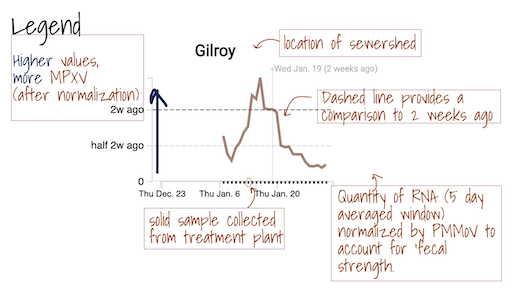
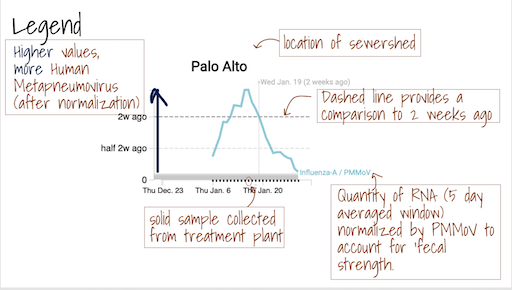
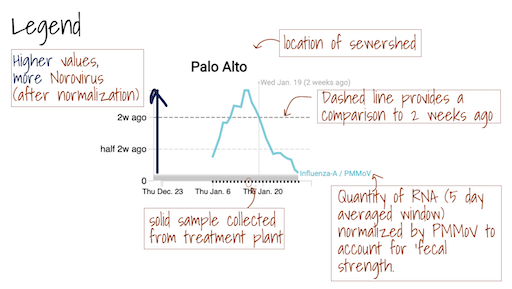
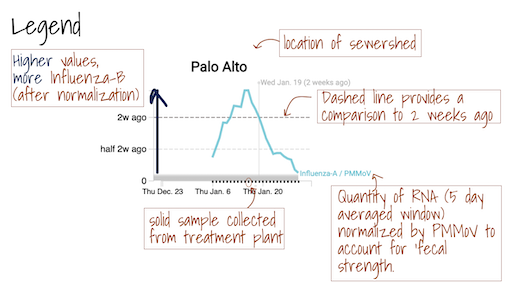
The grey area ━ at the bottom of the charts shows values below the approximate method detection limit. Trimmed averages may appear within this range when they include samples where the target wasn't detected, as these are recorded as 0.
This website is no longer being updated as of 11/22/24. To see the latest updates to the national WastewaterSCAN program, please visit data.wastewaterscan.org.
Sewershed Locations
- The pink area near Sacramento is the Sacramento sewershed.
- The red area near San Francisco is the Oceanside sewershed.
- The yellow area near San Francisco is the Southeast sewershed.
- The pink area on the peninsula is Silicon Valley Clean Water sewershed in San Mateo County.
- The purple area on the peninsula is the Palo Alto sewershed.
- The yellow area near San Jose is the Sunnyvale sewershed.
- The green area is San Jose sewershed.
- The light blue area is the Gilroy sewershed.
- Not shown is the area of the Codiga sub-sewershed which is part of the Palo Alto sewershed.
Details of methods used for detection of MPXV DNA in solids can be found here. When MPXV virus DNA is detected in wastewater solids, it indicates that there is at least one person in the area who is infected with the virus and shedding it into wastewater. More research is underway to understand how the concentration of the DNA in wastewater solids is related to cases in the community. These estimates can be improved as more data becomes available about MPXV cases in participating communities.
These plots show trimmed averages of concentrations of N and S over time in settled solids with a line for each wastewater treatment plant in SCAN. The data are plotted both as gene concentrations in copies per gram dry weight (right column), and those concentrations normalized by PMMoV copies per gram dry weight (left column).
Our analysis suggests that both the concentrations of the SARS-CoV-2 genes and those concentrations normalized by PMMoV are proportional to laboratory confirmed COVID-19 incidence rates in the sewersheds. Further, the relationship between these wastewater measures and COVID-19 incidence rates is consistent between the sewersheds in our study. That means a higher wastewater value at one plant compared to another suggests COVID-19 incidence rates are higher in that plants sewershed compared to the others.
To choose which plants to view on the plots, select or deselect the names of the plants you want to visualize. When the plant name is greyed out, it means that the data from that plant are not shown on the plot.
For more information about data shown here, please see the about page.
This plot shows the 5-d trimmed average of the concentration of the delta mutation (del156-157/R158G) divided by the concentration of N.
To choose which plants to view on the plots, select or deselect the names of the plants you want to visualize. When the plant name is greyed out, it means that the data from that plant are not shown on the plot.
For more information about data shown here, please see the about page.
This plot shows the 5-d trimmed average of the Del 143-145 omicron mutation (Del 143-145) divided by the concentration of N.
To choose which plants to view on the plots, select or deselect the names of the plants you want to visualize. When the plant name is greyed out, it means that the data from that plant are not shown on the plot.
For more information about data shown here, please see the about page.
These data were collected as part of the SCAN (sewer coronavirus alert network) project based out of Stanford University in collaboration with Emory University, with our implementation partner Verily Life Sciences LLC.
SCAN: Sewer Coronavirus Alert Network
Wastewater treatment plant sites
There are nine (9) wastewater treatment plants participating in SCAN including plants in San Jose, Gilroy, Sunnyvale, and Palo Alto in Santa Clara County, Silicon Valley Clean Water in San Mateo County, Oceanside and Southeast in San Francisco County, Sacramento in Sacramento County. The plants each serve between approximately 10,000 and over 1,000,000 people living in their sewersheds. There is one (1) experimental, pilot wastewater treatment plant that serves a sub-sewershed located within Stanford University called Codiga. Wastewater from approximately 10,000 people passes through the Codiga collection point.
Protocol
Settled solids from wastewater are collected from wastewater treatment plants by dedicated staff each day. Samples are “grab” samples from the primary clarifier at most plants with the following exceptions: 1) San Jose provides a manually collected composite sample from the primary clarifier; 2) Codiga, and Gilroy collect a 24-hour composite sample from their influent and then let it settle to generate a sample of settled solids. Plants finish their sample collection in the morning of each day and label the sample with the date when they cap the sample with the following exceptions: 1) Palo Alto collects their grab sample at 14:00 the day before the sample is picked up because that is the time of day when their primarily clarifier settled solids waste stream is thickest. They then hold the sample at 4°C until it is picked up the next day; the sample is labeled with the date it was collected. 2) San Jose labels their sample with the previous day’s date because that is the date for which the majority of the composite sample was collected. All samples are held at 4°C prior to analysis. We note that the “grab” samples mentioned above are in fact solids from the wastewater that are collected over many hours in the clarifiers. They are therefore essentially a composite of wastewater solids from the community over several hours.
Daily samples are retrieved from the participating wastewater treatment plants by Dalmatian Couriers and transported to Verily’s laboratory. Samples generally arrive by 12:00 pm. At the lab, they are processed for three SARS-CoV-2 genomic RNA targets. The targets have changed over the course of the study. Initially they included the N, S, and ORF1a genes; they then included the N and S gene, as well as a gene that targets a mutation found in the Delta variant (del156-157/R158G); between 1 Dec 2021 and late May 2022, they include the N and S gene, as well as a gene that targets a mutation found in the Omicron variant BA.1 and BA.1.1 (S:del143-145). We also added measurements of influenza A RNA, respiratory syncytial virus (RSV) RNA, and a mutation found in BA.2 (S:LPPA24S). In late May 2022, we added an assay that targets a deletion found in the genome of BA.4 (ORFA1: del141-143). In mid June 2022, we added an assay that targets a deletion in the S gene present in BA.4 and BA.5 (S:HV69-70). These genes are measured using RT droplet digital PCR. Results are reported as copies per dry weight of solids. Additionally, we measure pepper mild mottle virus (PMMoV) as an internal control and results for this target are reported per gram dry weight. Prior to nucleic acid extraction, samples are spiked with a vaccine strain of bovine coronavirus (BCoV) to measure the recovery of BCoV in each sample. Results are ready within 24 hours of sample drop off and uploaded to this site and distributed to stakeholders with the exception of Sundays. Sunday samples are analyzed and released on Monday.
It should be noted that the mutations we measure that are found in variants of SARS-CoV-2 are also found in other variants, so the presence of the mutation in wastewater does not provide certainty that the particular variant is present. Rather, the presence of the mutation suggests that the presence of the variant is possible but does not rule out the presence of the mutation contributed from other variant genomes. This Link provides a detailed description of considerations when attempting variant detection in wastewater either through sequencing or targeted PCR-based assays. However, our research suggests that the concentrations of characteristic mutations of variants of concerns is strongly associated with the fraction of clinical cases that are sequenced and assigned to the variant.
Laboratory analyses are available on protocols.io:
Aaron Topol, Marlene Wolfe, Brad White, Krista Wigginton, Alexandria B Boehm 2021. High Throughput pre-analytical processing of wastewater settled solids for SARS-CoV-2 RNA analyses. protocols.io Link.
Aaron Topol, Marlene Wolfe, Krista Wigginton, Bradley White, Alexandria B Boehm 2021. High Throughput RNA Extraction and PCR Inhibitor Removal of Settled Solids for Wastewater Surveillance of SARS-CoV-2 RNA. protocols.io Link
Aaron Topol, Marlene Wolfe, Brad White, Krista Wigginton, Alexandria B. Boehm. 2021. High Throughput SARS-COV-2, PMMOV, and BCoV quantification in settled solids using digital RT-PCR. protocols.io Link.
Bridgette Hughes, Brad White, Marlene Wolfe, Krista Wigginton, Alexandria Boehm 2021. Quantification of SARS-CoV-2 variant mutations (HV69-70, E484K/N501Y, del156-157/R158G, del143-145, LPPA24S) in settled solids using digital RT-PCR. protocols.io Link.
Bridgette Hughes, Brad White, Marlene Wolfe, Krista Wigginton, Alexandria Boehm 2021. B. Hughes, B. J. White, M. K. Wolfe, A. B. Boehm. 2022. Quantification of SARS-CoV-2 variant mutations (HV69-70, E484K/N501Y, del156-157/R158G, del143-145, LPPA24S, S:477-505, and ORF1a: Del 141- 143) in settled solids using digital RT-PCR. protocols.io Link.
These protocols, and others we use for influenza A and RSV are described in, and based on analyses in these pre-prints and publications:
Marlene K Wolfe, Dorothea Duong, Bridgette Hughes, Vikram Chan-Herur, Bradley White, Alexandria Boehm. Detection of monkeypox viral DNA in a routine wastewater monitoring program. medRxiv 2022.07.25.22278043. Link.
A. B. Boehm, B. Hughes, M. K. Wolfe, B. J. White, D. Duong, V. Chan-Herur. Regional replacement of SARS-CoV-2 variant Omicron BA.1 with BA.2 as observed through wastewater surveillance. Environmental Science & Technology Letters. Link.
M. K. Wolfe, D. Duong, K. Bakker, M. Ammerman, L. Mortenson, B Hughes, E. Martin, B. White, A. B. Boehm, K. R. Wigginton. 202X. Wastewater-based detection of an influenza outbreak. Preprint link.
M. K. Wolfe, B. Hughes, D. Duong, V. Chan-Herur, K. R. Wigginton, B. White, A. B. Boehm. 2022. Detection of SARS-CoV-2 variant Mu, Beta, Gamma, Lambda, Delta, Alpha, and Omicron in wastewater settled solids using mutation-specific assays is associated with regional detection of variants in clinical samples. Applied and Environmental Microbiology. Link.
L. Roldan-Hernandez, K. E. Graham, D. Duong, A. B. Boehm. 2022. Persistence of endogenous SARS-CoV-2 and pepper mild mottle virus RNA in wastewater settled solids. ACS ES&T Water. Link.
A. Yu, B. Hughes, M. Wolfe, T. Leon, D. Duong, A. Rabe, L. Kennedy, S. Ravuri, B. White, K. Wigginton, A. Boehm, D. Vugia. 2022. Estimating relative abundance of two SARS-CoV-2 variants through wastewater surveillance at two large metropolitan sites. Emerging Infectious Disease, 28(5), 940-947. Link.
Kirby AE, Welsh RM, Marsh ZA, Yu AT, Vugia DJ, Boehm AB, Wolfe MK, White BJ, Matzinger SR, Wheeler A, Bankers L, Andresen K, Salatas C, NYDEP, Gregory DA, Johnson MC, Trujillo M, Kannoly S, Smyth DS, Dennehy JJ, Sapoval N, Ensor K, Treangen T, Stadler LB, Hopkins L. 2022. Notes from the Field: Early Evidence of the SARS-CoV-2 B.1.1.529 (Omicron) Variant in Community Wastewater - United States, November - December 2021. MMWR Morb Mortal Wkly Rep 2022;71:103- 105. DOI: http://dx.doi.org/10.15585/mmwr.mm7103a5.
S. Kim, L. Kennedy, M. Wolfe, C. Criddle, D. Duong, A. Topol, B. J White, R. Kantor, K. Nelson, J. Steele, K. Langlois, J. Griffith, A. Zimmer-Faust, S. McLellan, M. Schussman, M. Armmerman, K. Wigginton, K. Bakker, A. Boehm. 2022. SARS-CoV-2 RNA is enriched by orders of magnitude in solid relative to liquid wastewater at publicly owned treatment works. Environmental Science: Water Research & Technology, DOI: 10.1039/D1EW00826A. Link.
B. Hughes, D. Duong, B. J. White, K. Wigginton, E. Chan, M. Wolfe, A. Boehm. 2021. Respiratory Syncytial Virus (RSV) RNA in wastewater settled solids reflects RSV clinical positivity rates. Environmental Science & Technology Letters, 9(2), 173-178. Link.
M. K. Wolfe, A. Topol, A. Knudson, A. Simpson, B. J. White, D. J. Vugia, A. T. Yu, L. Li, M. Balliet, P. Stoddard, G. S. Han, K. R. Wigginton, A. B. Boehm. 2021. High frequency, high throughput quantification of SARS-CoV-2 RNA in wastewater settled solids at eight publicly owned treatment works in Northern California shows strong association with COVID-19 incidence. mSystems, 6(5), e00829-21. DOI: doi/10.1128/mSystems.00829-2. Link.
A. Simpson, A. Topol, B. White, M. Wolfe, K. Wigginton, A. B. Boehm.Effect of storage conditions on SARS-CoV-2 RNA quantification in wastewater solids. PeerJ 9:e11933.; doi: 10.1101/2021.05.04.21256611. Link.
J. S. Huisman, J. Scire, L. Caduff, X. Fernandez-Cassi, P. Ganesanandamoorthy, A. Kull, A. Scheidegger, E. Stachler, A. B. Boehm, B. Hughes, A. Knudson, A. Topol, K. R. Wigginton, M. K. Wolfe, T. Kohn, C. Ort, T. Stadler, T. R. Julian. 2022. Wastewater-based estimation of the effective reproductive number of SARS-CoV-2. Environmental Health Perspectives. Link.
M. K. Wolfe, A. Archana, D. Catoe, M. M. Coffman, S. Dorevich, K. E. Graham, S. Kim, L. Mendoza Grijalva, L. Roldan-Hernandez, A. I. Silverman, N. Sinnott-Armstrong, D. J. Vugia, A. T. Yu, W. Zambrana, K. R. Wigginton, A. B. Boehm. 2021. Scaling of SARS-CoV-2 RNA in settled solids from multiple wastewater treatment plants to compare relative incidence of laboratory-confirmed COVID-19 in their sewersheds. Environmental Science & Technology Letters, 8, 5, 398- 404. Link.
K. E. Graham, S. K. Loeb, M. K. Wolfe, D. Catoe, N. Sinnott-Armstrong, S. Kim, K. M. Yamahara, L. M. Sassoubre, L. M. Mendoza, L. Roldan-Hernandez, L. Li, K. Langenfeld, K. R. Wigginton, A. B. Boehm. 2021. SARS-CoV-2 RNA in wastewater settled solids is associated with COVID-19 cases in a large urban sewershed. Environmental Science & Technology, 55, 488-498. Link.
What is plotted
The Overview plots show consensus smoothing of the SARS-CoV-2 gene (N gene, S gene, Omicron mutation in BA.1 Del 143-145 gene, BA.4 deletion (ORF1A:del141-143), BA.2, BA.4, and BA.5 mutation LPPA24S and BA.4 and BA.5 mutation (S:HV69-70)) concentrations normalized by PMMoV concentrations in the solids. The resultant ratio is unitless. Normalizing the SARS-CoV-2 genes by PMMoV conceptually corrects for measurement-to-measurement changes in RNA recovery and fecal strength. This assumes that RNA recovery from PMMoV is similar to that of SARS-CoV-2 RNA, and that PMMoV adequately controls for fecal strength of the sample. The trimmed average uses 5 consecutive samples, first eliminating the maximum and minimum among the 5 samples and then taking the mean. The smoothing is centered, so the values for Jan 10th will be based on Jan 8th, 9th, 10th, 11th, and 12th. For the most recent two days of data, it will just use the 3 or 4 values available. The y-axis shows a linear scale.

The Location Drilldown shows all data collected for each sample. The errors on each point represent standard deviations from the digital RT-PCR measurement and include Poisson error as well as variation among 10 replicate wells. The normalized, as well as unnormalized, SARS-CoV-2, influenza, and RSV targets are shown. The reported ratio error is propagated from the errors on the viral gene and PMMoV gene measurements assuming that the relative error is additive among the numerator and denominator. The quality control data included for each site shows the bovine coronavirus recovery, as well as the measured PMMoV concentration in copies per gram dry weight of solids.
This document provides additional information about what specific factors lead to variability in this dataset, how these differ from the types of variability we expect in clinical case or syndromic data, and what actions have been taken to mitigate those sources of variability.
Data Licensing and Use
SCAN is run by Alexandria Boehm and Marlene Wolfe. If you want to use these data or have questions about these data, please contact us (aboehm@stanford.edu, marlene.wolfe@emory.edu). Data visualization created by Zan Armstrong.
During the COVID-19 pandemic, we are making the wastewater data on this website available. Except where noted,
content on this site is licensed under CC BY-NC 4.0. By accessing
or copying any part of the database, the user accepts the terms of this license. Anyone seeking to use the
database for other purposes is required to contact Alexandria Boehm to obtain permission.
Our team has made every effort to ensure the accuracy of the information. However, the database may contain typographic errors or inaccuracies and may not be complete or current at any given time. Licensees further agree to assume all liability for any claims that may arise from or relate in any way to their use of the database and to hold our team harmless from any such claims.